
I went down to Knoxville for The Collective conference this weekend, and I am so honored to have been among this particular group of presenters. This conference was an absolute highlight of my time in “traditional” libraries. The attendees at all the sessions I went to asked fantastic questions, and our presentation was no exception.
Colin and I spent about 25 minutes demonstrating our particular implementation of Google Drive and how we used library data to automatically update a Google Site that functions as a system-wide dashboard.
We had planned to walk attendees through the process of creating forms and linking spreadsheets to perform calculations via the range, countif, and array functionality within Google Sheets, but, aside from a few questions from Jeff about specific formulas, and one about the features of Google Sites, we were pretty much completely off base about the direction our presentation wound up going. We wound up having a really solid hour of free-form conversation bouncing off of each other, which seems to be what The Collective is all about.
My big takeaway from my time working with library data is the following: DEMAND CSV EXPORTS OF YOUR RAW DATA FROM VENDORS. If every single library demanded this and included it in their contracts, we’d probably be able to get it from a portion of our vendors. If you have a good relationship with your representative you usually CAN figure out a way to get it. We have tons of insights from getting a CSV dump from our ILS every month.
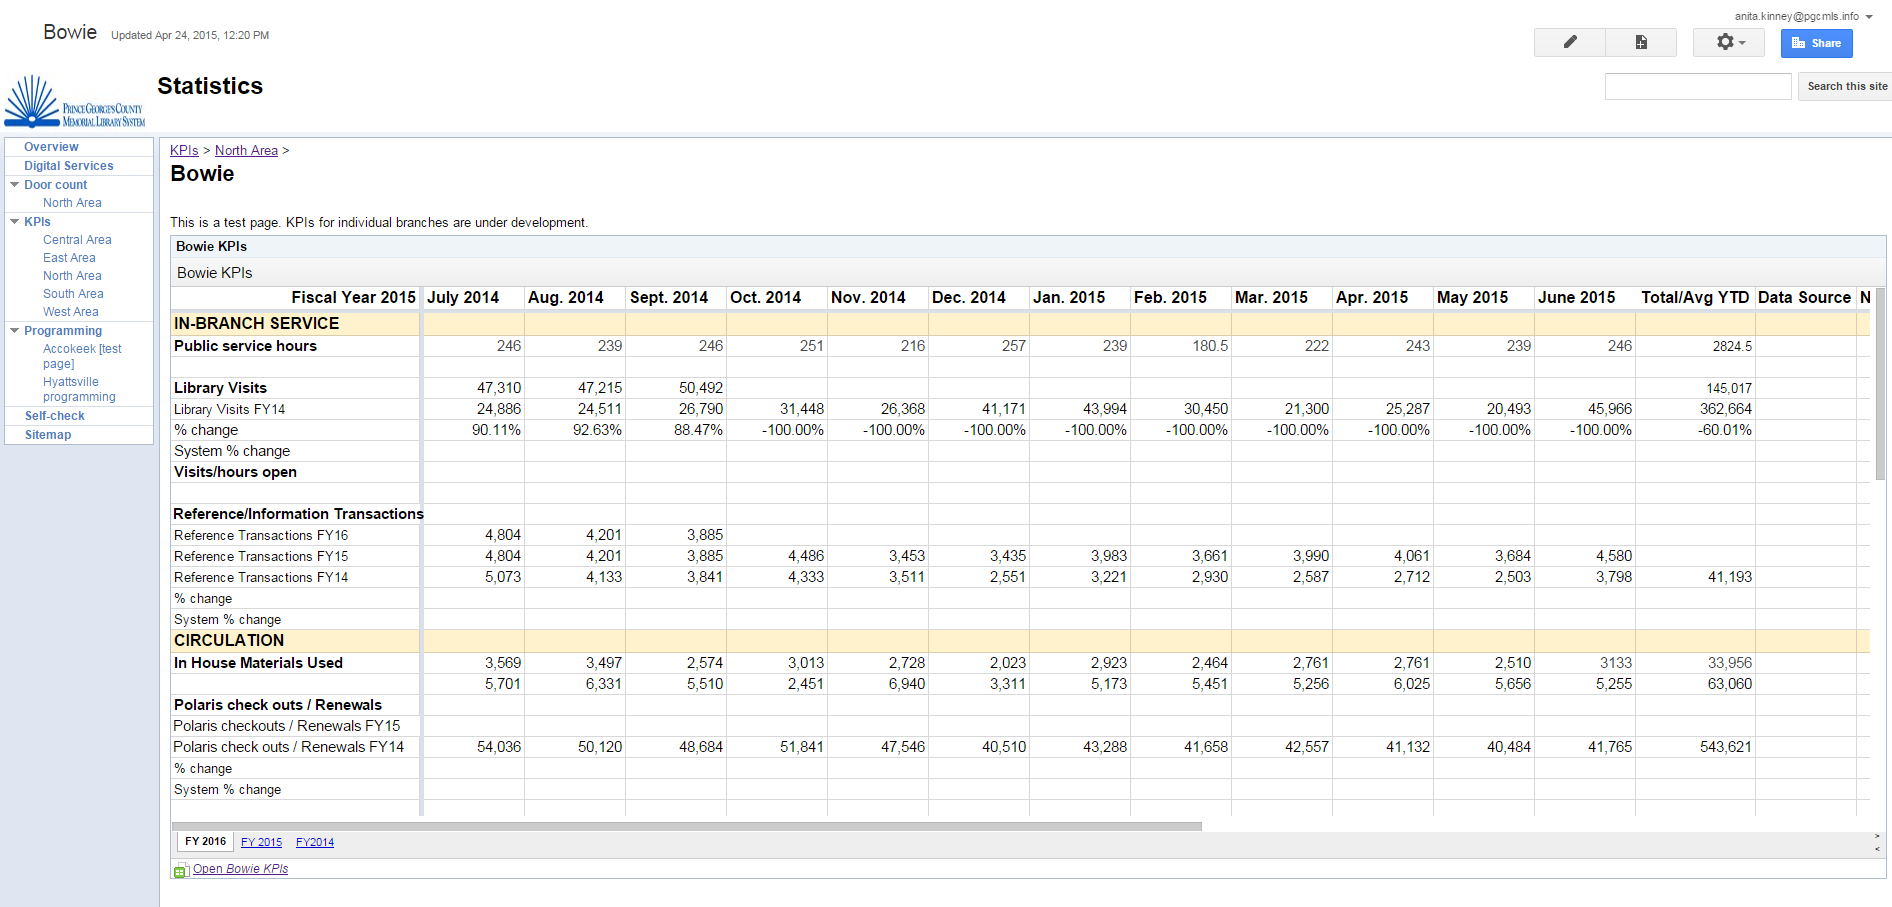
Circ stats in this worksheet update themselves from a CSV dump (the rest of the stats come from the Google Forms).
This conference was definitely set up well to encourage community note-taking (there was an assigned notetaker for our session! And an open Google Document linked to from our presentation’s page on the Collective’s Sched conference page) but I think we were all so busy talking that our notes didn’t really capture the conversation, so I’m writing some thoughts here (and, as they come to me, I’ll try to beef up the community notes).
A few themes that have stayed with me:
1) People were really curious about whether there was resistance from front-line staff in logging detailed reference interactions at the time of service. We showed the first iteration of the form we used to have our library branches report their daily usage statistics. Then, we showed the second form, which is much more detailed.
To be frank, we haven’t really gotten pushback possibly because staff were used to doing less detailed transaction logs already. When I started, it was an Excel sheet with 31 tabs that people filled out with aggregate statistics for each day, in the tab for each day of the month! So, they were really excited to have a simple form to fill out. Our initial form looked like this:
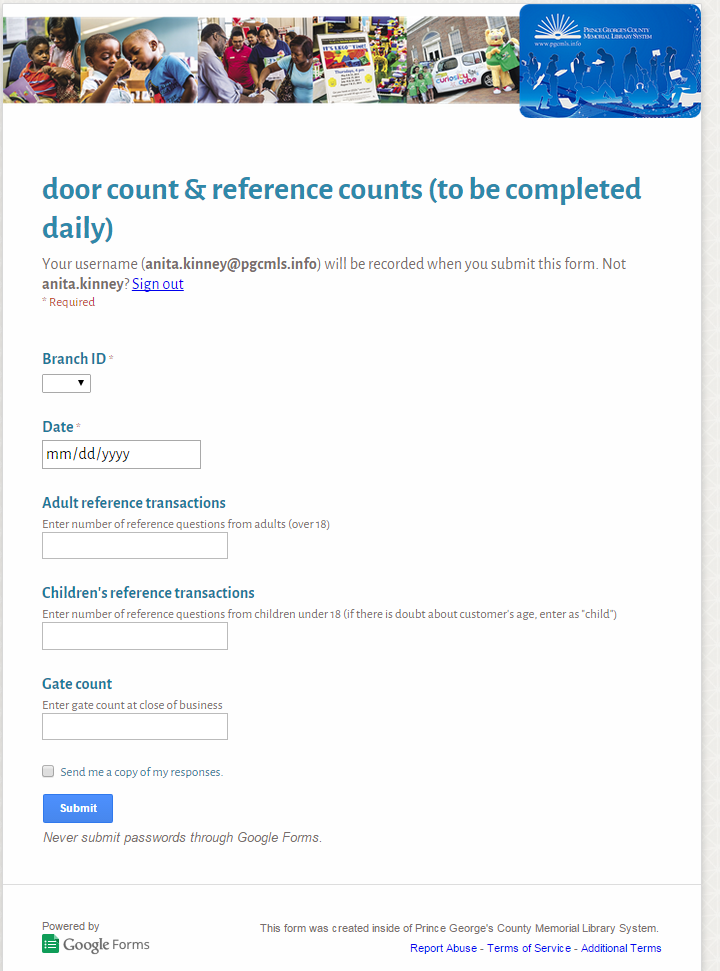
When Colin took over, he made a very detailed reference transaction log that branches filled out after EVERY transaction. But, that was Phase 3: Phase 2 (the form above) was such an improvement on the Excel sheets that the usage stats shot up once we implemented it, and it shot up AGAIN because folks were underestimating their reference transactions. As soon as they started filling out the forms, we’d also given them access to see the data being reported from their and other branches, and they were excited about having MOAR DATA available. When they first started tracking transactions daily, the usage went up a LOT, because stuff was getting reported more accurately.
Here’s my advice for people encountering resistance from staff: make a vendor do your dirty work. SpringShare offers REALLY reasonable packages for their LibAnalytics product, and the training included can address some of the issues that come with trying to change culture in-house. I’ve been really happy in my dealings with SpringShare, they seem to really understand the library space, have responsive reps, etc. If you’ve hit a wall with stats reporting, I’d STRONGLY consider a one-year contract for the LibAnalytics: I haven’t had experience USING it but from the demos I got, it looked like they were collecting a lot of the same information we wanted to, it seemed like you could make some changes to it, and, you’re going to get your money’s worth by introducing the dynamic of an outside consultant making the case for data logging. Did I mention it’s pretty inexpensive? I liked what I saw of the product (which was right about at release time when I last looked at it), I think it’s comparable to paying a consultant to do training, plus you get to use a product that you might actually want to KEEP using – I think it’s very possible that a lot of libraries would want to stick with their LibAnalytics product suite, so you might get a two-for-one here.
2) Does a project like this have to be done by designated staff? Is it possible for people to work on these kinds of tasks as side projects? When does it make sense to create an FTE position, versus working with a contractor?
My take: YES, a Google implementation like this can be built without an FTE, IF you are able to set aside a big chunk of time (say, 2 weeks of someone’s time) for the initial setup. I DON’T think a vendor is a good fit for setting up your dashboard – I think you’ll get the most out of a relationship with a vendor if you have already decided, in-house, EXACTLY what you want the dashboard to look like.
3) Google Sites? What? Realized during the presentation that Google Sites (which allow you to embed your spreadsheets, AND any charts you’ve built on said spreadsheets, making it possible to give people in your org access without having to share individual files with them through Drive) are pretty much unknown. This makes working around IT a cinch – for some reason the permissions often aren’t locked down, so you can get a really fast and dirty workaround.
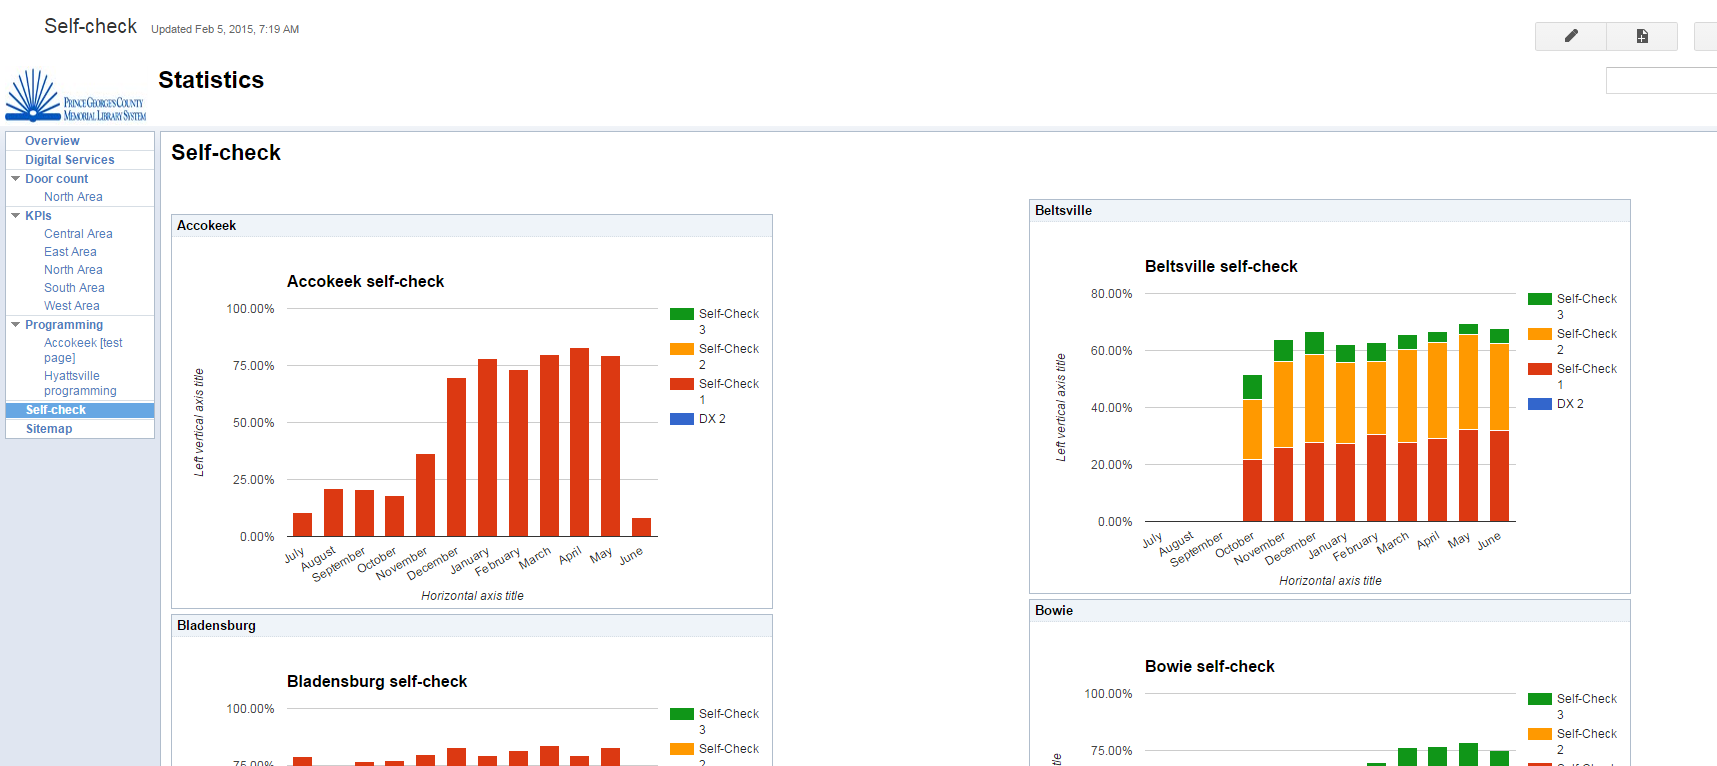
This one is done entirely in Google sites.

This one took a little bit of coding to embed a chart from Infogr.am (which lets you plug into Google Sheets – Tableau is working on stuff like this for us), but still very straightforward.
4) We’ve had better luck working with enterprise vendors interested in moving into the nonprofit space, than I have with designated library vendors. Please contact us if you’d like to hear about our experience with Tableau. (Note: emailed someone from the conference who was looking into Tableau and discovered that her organization already had a subscription and a relationship – not unlikely that, like SharePoint, academic librarians may already have an institutional subscription!)
5) Finally, the best way to deal with data from vendors is generally from a CSV export. I think all libraries should specify in their contracts that they need to be able to export all raw usage data as a CSV file. I know lots of reasons that this may not be possible (like, being held hostage by certain vendors) but if it’s not an essential service, I’d try to get in writing that you’ll get weekly or monthly CSV dumps, as suit your needs. A lot of the reason we’re able to get good data in our “dashboards”, or Key Performance Indicators, is that they update themselves from a CSV.
6) The only work in updating these sites is by cutting and pasting data from a CSV each month into Google Drive. It’s a cinch. It will change your data workflow. There’s an annual “switch” where we archive the data from the previous year, and you’ll have to build a few new charts, etc. but that’s a time investment of about 40 hours at the beginning of each fiscal year.